mastodontech.de ist einer von vielen unabhängigen Mastodon-Servern, mit dem du dich im Fediverse beteiligen kannst.
Offen für alle (über 16) und bereitgestellt von Markus'Blog

Serverstatistik:

1,5 Tsd.
aktive Profile

#dataanalysis

1 Beitrag1 Beteiligte*r0 Beiträge heute

Discover how to use AirTable for data analysis with this beginner’s guide. AirTable blends the best of spreadsheets and relational databases for efficient data management. Learn about setting up projects, importing data, and performing basic analyses. Perfect for small projects or beginners. #AirTable #DataAnalysis #DataScience #BeginnersGuide kdnuggets.com/a-beginners-guid

KDnuggetsA Beginner's Guide to AirTable for Data Analysis - KDnuggetsAirTable combines the best of spreadsheets and relational database management systems: discover in this article how to get started with this plataform for data analysis.

techxplore.com/news/2025-08-pa

#Palantir,… #dataanalysis and #AI company, has a reach that spans the global economy, with banks, hospitals, the US gov, and the #IDF among its…client roster.

"We want and need this country to be the strongest, most important country in the world," Alex Karp, Palantir's CEO, recently declared at a client conference in Palo Alto, California.

…founded by #PeterThiel — preeminent conservative with long-standing ties to the Trump admin—Karp, and others with #CIA backing.

Tech Xplore · Palantir gets US Army contract worth up to $10 blnVon Science X

Why normalize databases?
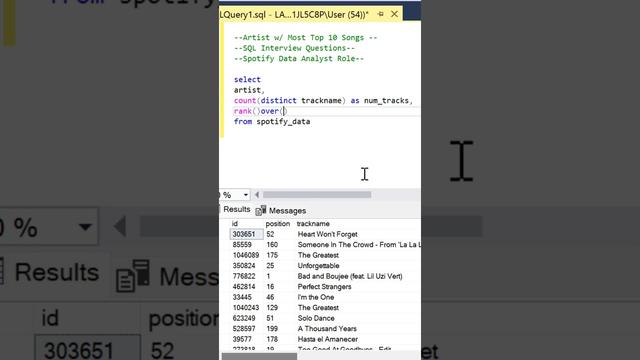
Yesterday, my tutoring student asked me why databases need to be normalized at all. She said: “Wouldn’t it be easier to just have one big table with all the information?”

It’s a common first question when learning about relational databases.
At first, one big table (e.g. customer name, order date, product name, price) seems easiest.

I told her:
:blobcoffee: Because that quickly leads to data redundancy, anomalies, and integrity issues when inserting, updating, or deleting records.
:blobcoffee: Normalization means structuring data into separate, related tables, so that each fact is stored only once. This reduces redundancy & preserves consistency.

New open-source tool makes complex data understandable

Y'all heard about this?

New dopamine source potentially unlocked.

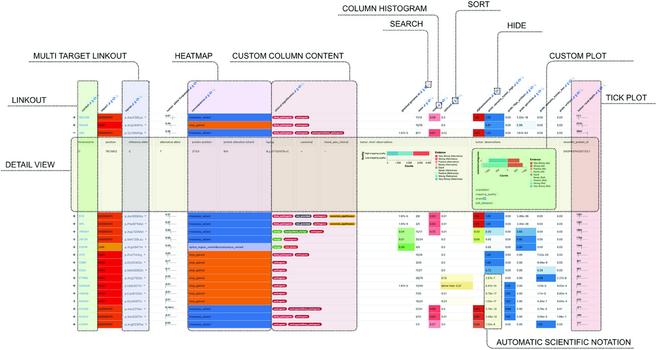
Create interactive HTML-based reports fed by CSVs, TSVs, or JSON data with the format described using YAML instead of using an exported CSV to Alteryx to MS SQL to Power BI pipeline? Yes, please.

We thought moving to using Python and APIs to skip the "CSV to Alteryx" step was increasing efficiency (and decreasing software license costs). I think this would be even better. Too bad we would have to learn a new tool and don't have time.

Tech Xplore · New open-source tool makes complex data understandableVon Ulrike Bohnsack

Datavzrd is a new tool for interactive visualization of tabular data that takes output specifications in YAML format and produces portable output that does not require a server process.

Summary: techxplore.com/news/2025-07-so

Original paper: journals.plos.org/plosone/arti

Tech Xplore · New open-source tool makes complex data understandableVon Ulrike Bohnsack